Since the rollout of Rstudio and Bioconductor last quarter, our Interactive Analysis team has been hard at work expanding the capabilities of the cloud environments framework that supports running RStudio, Jupyter Notebook and Galaxy in Terra. Most recently, they added the ability to launch R Shiny apps from Terra’s built-in RStudio environment, opening up some really exciting possibilities for taking interactive data visualization in Terra to the next level.
The R package that launched a thousand COVID-19 trackers
If you’re not already familiar with Shiny, it’s an R package developed by the makers of RStudio that enables data scientists to develop interactive web apps for data exploration and visualization without requiring any software engineering or web development experience. The apps made with Shiny can be shared as just code or as pre-built containers, and can be run on a local machine or hosted on a web server, in various forms: as standalone web pages, embedded in R Markdown documents, or set up as dashboards.


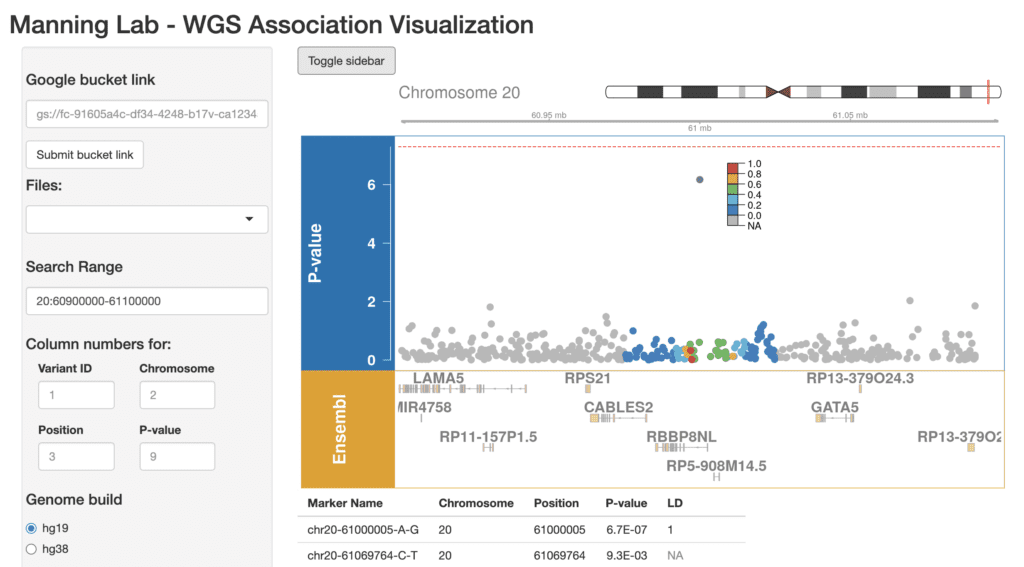
Example of an open-source R Shiny app developed by the Manning Lab to visualize whole-genome association data.
Thanks to this combination of flexibility, power, and ease of use, R Shiny apps have rapidly become hugely popular as a way to make custom data visualizations available to a wide audience. It’s now increasingly common to see researchers publish an R Shiny app as part of a paper to enable readers to explore their dataset and results interactively. And based on some admittedly anecdotal googling, R Shiny seems to be the technology most commonly used across the world for making dashboards that track various dimensions of the COVID-19 pandemic — which itself seems to have become the top example used in online data science visualization tutorials. (Seriously, there are so many…)
How it works in general, and in Terra
In its simplest form, an R Shiny app consists of a file of R code called “app.R”, which may be accompanied by some accessory files. Technically you can launch the app from the command line with the appropriate commands, but the RStudio interface makes it extra easy with a literal “Run App” button that pops up when you open the app.R file.
Terra’s built-in RStudio environment comes with the Shiny package pre-installed and is configured to handle the Run App function appropriately, so you can effectively follow the same procedure as for launching the app from RStudio on a local machine. Doing so will open a new browser window for the app, at which point you’re free to play with the data in whatever fun way the app offers.
Here’s a demo video of what it looks like to launch an R Shiny app from an RStudio environment in Terra (workspace and app courtesy of the Manning Lab). To keep it short, we shortened the sequences showing package installation steps; for detailed instructions, see the workspace dashboard.
If the resolution doesn’t look right when viewing in full screen, click the YouTube logo in the lower right corner of the player to go watch the video in its original format on YouTube.
Keep in mind that any R Shiny app that you launch in your cloud environment is, like anything else in your cloud environment, visible only to you. So while you can easily share the app itself with others, either as code or as a pre-built container, your collaborators will have to run it for themselves, either in their own cloud environment if they use Terra too, or through one of the many other options supported by R Shiny. If you’re interested in providing a publicly hosted R Shiny app as a service to the community, have a look at the guidance for sharing and hosting RShiny apps, which includes both free and paid options.
Your time to shine
Ready to try it out for yourself? The demo video above is based on a public workspace developed by the Manning Lab, which conveniently includes full instructions for replicating the procedure and launching their WGS association visualization app. All you need to do is clone the workspace under your own billing project, create or spin up an RStudio environment, and follow the few steps detailed in the workspace dashboard page to launch the app and load the dataset as shown in the video.
Once you have that experience under your belt, you should be able to run just about any R Shiny app that you come across as long as the code is in Github and its dependencies are properly documented. And, of course, any R Shiny app that you develop yourself!


