One of the biggest shifts involved in migrating from on-premises computing infrastructure to a cloud service is getting used to the pay-as-you-go model. There are substantial benefits to this model, yet there are also some fairly sizable risks, so it’s important to have a solid understanding of how it works and what you can do to minimize your risks. In this blog, I go over some key concepts and practical solutions for tackling the question of compute costs incurred by running workflows, which are typically the hardest to predict among the various types of cloud costs.
Tracking the cost of workflow runs to predict future costs
We can’t predict how much an arbitrary workflow is going to cost to run, because it depends on too many factors. However, we have found that we can fairly reliably predict how much future runs will cost based on initial test runs, for datasets of similar size and quality. That’s why in the Public workspaces featured in the Showcase, we provide typical costs on the dashboard page for easy reference.
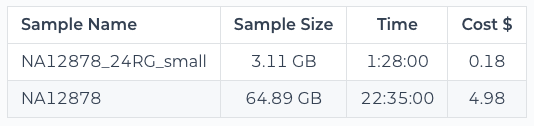
Workflow cost table shown in the dashboard of a public workspace
Wherever possible, we do this both for a small dataset that we use to test whether the workflow runs successfully end-to-end, and for a full-size dataset that is intended as a realistic proxy for data that you might use in an actual project. You can see in the example above that the runtime and cost scale mostly linearly relative to the size of the data, which allows us to extrapolate from there.
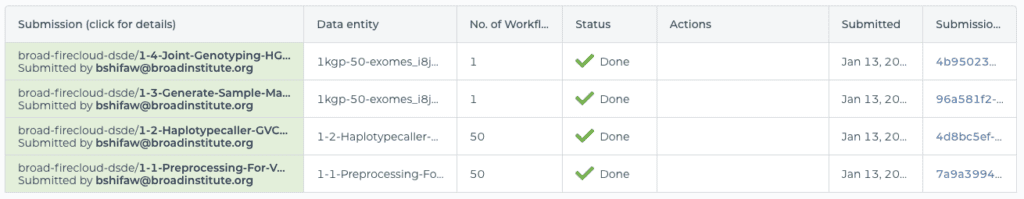
We get the cost numbers by running the workflow with the exact data and configuration set up in the workspace. For a given workflow submission (which may include multiple workflow runs), the resulting cost is reported in the submission details page under the Job History tab of the workspace, both as an overall “Total run cost”, and itemized in a table that shows details per individual workflow run.

Submission details page showing Total Run Cost (top right) and per-workflow Run Cost (fourth column from the left)
For each workflow, the corresponding run costs are added to the table after the workflow has stopped running (whether it succeeded, failed or was aborted), and the total run cost is calculated after all the workflows in the submission have stopped running. (Be aware however that it can take a few hours for the cost to show up in the table.)
In the example above, you can see one of the runs cost significantly more than the others; $0.34 vs. an average of about $0.17 for the others. Granted, that’s only a difference of 17 cents, but it is double the cost of the others, which for a full-size dataset could make a more meaningful difference, so it’s worth digging into a little.
To understand why a particular run cost more, you can open up the workflow run details in a new page called “Job Manager” (click the symbol that looks like a little checklist in the right hand column). On the new page, you can examine the workflow details to look for common issues: an unusually large input file or set of input files; steps that required multiple attempts, often indicating errors or preemptions; or steps that took an unusually long time to run, which can be a symptom of problems in the data itself.
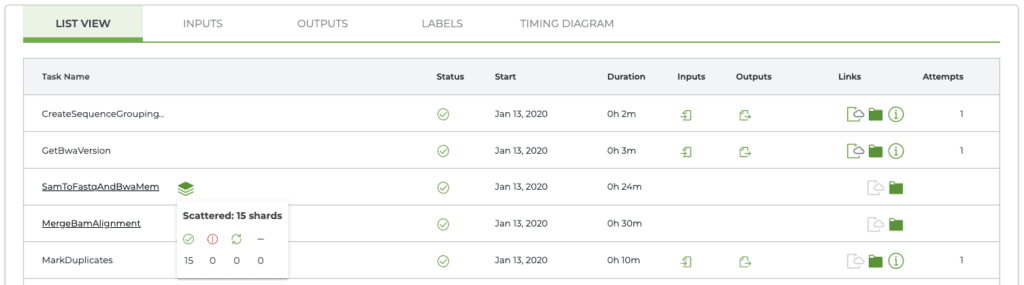
Workflow details page in Job Manager page
In the case of our example, it seems the more costly sample simply comprised a lot more data than the others (details not shown). This illustrates the importance of checking input sizes whenever you’re preparing to run a new batch of samples, even if you think you have a good sense of what a given workflow run should cost.
Getting the Run Cost for your own workflows
Hopefully, I’ve convinced you by now that monitoring the cost of past workflow runs can be very useful information, yet you may have noticed that in your own workspaces, the Run Cost column just says “N/A” for “not available”. The reason for this is that all the billing information is handled by Google Cloud directly (not by Terra), so by default the Terra system that produces the Job History pages can’t access the information on your behalf. Fortunately, there are two ways you can get access to that information.
Give Terra permission to retrieve billing information
If you’d like to have the Run Cost column in the Job History pages be populated, you can choose to give the Terra system permission to access your account and retrieve that information on your behalf. To do that, follow the instructions given under “Grant Terra Billing project access” in this document. It will take you a few minutes to work through all the setup steps in the Google Cloud console, but unless you have multiple billing accounts it should be a one-time thing only.
Note that this approach does require that you yourself have sufficient permissions to access and share billing information. If you do not, you will need to ask your account administrator to do this for you.
Retrieve billing information yourself through a utility notebook
If you’d rather not give Terra that level of access, or you’re not able to, there’s another way to get at that information yourself: you can send a particular set of commands to BigQuery, the Google Cloud system that stores your billing information, to retrieve it.
We provide a utility notebook that you can use to do this conveniently. The procedure is described in the notebook itself and is fairly straightforward, but let’s go over the four main steps.
Bring a copy of the notebook into the workspace that contains the workflow runs for which you want to get billing information. The commands in the notebook access the enclosing workspace information and use it as part of the retrieval operation, so you must run the notebook from within the relevant workspace; otherwise, the operation will fail with a somewhat cryptic error about not finding the requested entry.
Look up the relevant “submission ID” in the Job History tab of your workspace. It’s the string of letters and numbers shown in the right-most column of the submissions table; this is a unique identifier that the system uses at multiple levels to track the contents and metadata associated with that workflow submission.
You can also get the notebook itself to list all submissions made within the same workspace, but if you have a lot of them it can be difficult to identify the one you care about.
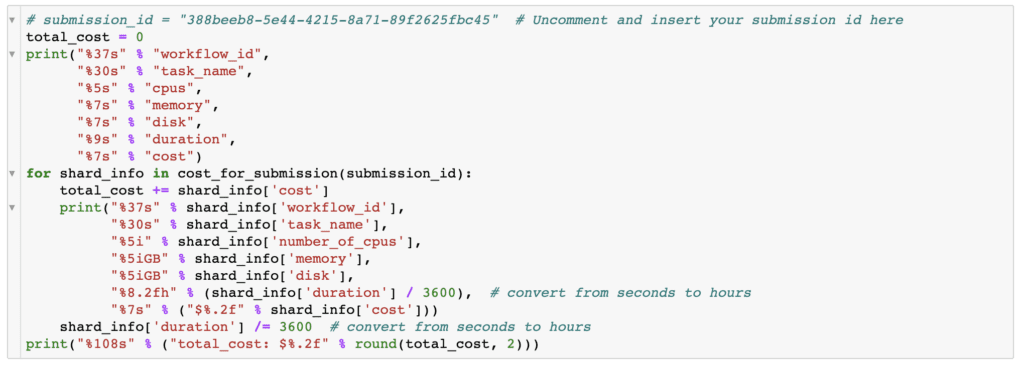
Plug the submission ID into the notebook. Once you’ve found the right submission ID, you’ll need to uncomment the first line in the notebook cell shown below and substitute your submission ID:
The edited line will look something like this:
submission_id = "388beeb8-5e44-4215-8a71-89f2625fbc45"Execute all the cells in the notebook. You should see a table appear below the cell shown above, listing each workflow in the submission, with a breakdown of costs for each task that was run as part of the workflow (including separate “shards” if the work was parallelized through a scatter function). For each task, you’ll see a line listing the amount of CPUs, memory and disk space that were used, as well as duration and cost. The notebook does not calculate a subtotal for each workflow run (though you could modify it to do so); the total run cost listed after the itemized per-task costs refers to the overall cost of the submission across all of its workflow runs.
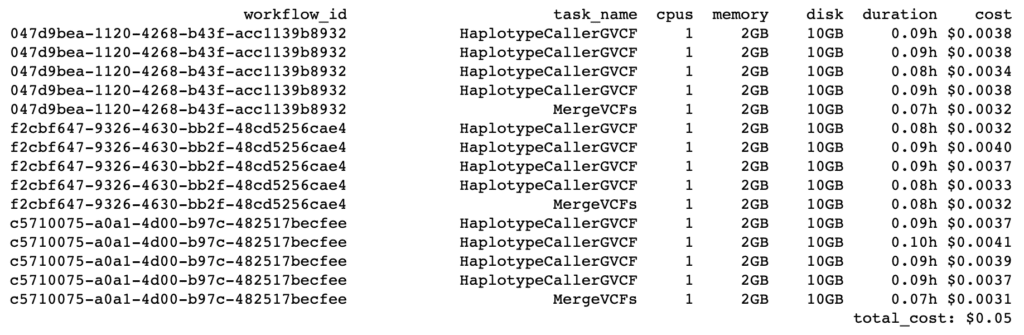
Note that by default the notebook command that writes out the table rounds up costs to the second decimal place, so if you’re running a minimalist test like what I used here, where per-task costs amount to very small numbers, you may need to modify the command to allow more decimal places. As an example, to get the output table shown above I changed this line:
"%7s" % ("$%.2f" % shard_info['cost'])) to:
"%7s" % ("$%.4f" % shard_info['cost']))in the cost summary cell, to go from two (.2f) to four (.4f) decimal places.
Finally, there are a few differences worth noting between the costs reported by the notebook compared to what is reported in the Job History tables. This is because the notebook commands leave out a few sources of minor charges that are reported separately. As a result, the notebook numbers will typically be slightly less than the “real” cost reported in the tables and charged to your account. However, in our experience, those differences are usually very minor (see comparison in the last section of this document) and should generally not be a cause for concern.
On the bright side, the notebook approach actually allows you to retrieve costs for workflows that have not yet finished running, so you can use it as an early warning system to catch unexpectedly high costs early in the process when you launch a big submission.
Further reading
I hope the above will be helpful for you as you come to grips with the world of cloud computing costs. Some details may change over time, so be sure to check out the document on workflow costs as the ultimate source of truth and nitty-gritty details. I’ve also included links to a few additional articles about billing and costs in the Resources section below, which may be helpful if you are looking to learn more about what costs money in the cloud and how to manage billing in Terra.
You may also be interested in this slide deck shared by Michael Schatz, Professor at Johns Hopkins University and one of our close collaborators on the AnVIL project. He recently spoke at the ISMB 2021 conference about modeling cloud costs for genomics based on his experience with the Telomere-to-Telomere (T2T) project, as well as metadata available from the Galaxy project.
And as always, don’t hesitate to reach out to our support team if you have any additional questions or run into any trouble.
Resources
How much did a workflow analysis cost? — The original document describing the steps summarized in this blog post.
Understanding and controlling cloud costs — A detailed breakdown of the types of costs that you may incur when working on Google Cloud, plus some advice on how to reduce costs.
Understanding costs and billing in Terra — An overview of how billing works, including how billing accounts, projects and workspaces related to each other, and the difference between workspace permissions and billing permissions.
Controlling cloud costs – sample use cases — A selection of typical analysis use cases, for which the costs are broken down in several scenarios in order to illustrate the effect of cost control strategies.