Yossi Farjoun is a Senior Biostatistician at the Richards Lab of the Lady Davis Institute in Montreal. He previously worked in the Data Sciences Platform at the Broad Institute, where he led a “special projects” team that was occasionally tapped to help the Broad’s Genomics Platform lab diagnose strange issues. In this guest blog post, Yossi shares a particularly intriguing story about how he was able to quickly identify the cause of mysteriously low sequencing alignment rates in a sequencing project, with step-by-step descriptions for recapitulating the work in Terra.
It all started when a project manager in the sequencing lab told me that they were seeing low alignment rates on multiple samples from the same project, and asked if I could help. We would normally see alignment rates (as reported from Picard’s CollectAlignmentSummaryMetrics) above 99%, but this cohort of samples was producing rates between 60% and 95%, requiring the lab to sequence more material in order to reach the contractual target coverage for the project (which doesn’t include unaligned reads, of course).
I suspected bacterial contamination since, by manual inspection, the unaligned reads did not seem to be artifactual. For example, they all had pretty random-seeming sequences, as opposed to being all the same. To investigate the problem, I decided to use GATK PathSeq, a computational pathogen discovery pipeline that is included in the Genome Analysis Toolkit (GATK) for detecting microbial organisms from short-read deep sequencing of a host organism.
In this blog post, I’ll walk you through how I used PathSeq to quickly identify that the unaligned reads all belonged to a single bacterial genus, Burkholderia. The two main steps were running the PathSeq pipeline then analyzing the results in Python in a Jupyter Notebook. At the time I did the work, I used FireCloud — an early version of the Terra platform that was primarily intended for cancer research — but I’ve updated the walkthrough to refer to Terra for simplicity since it’s the same platform under the hood, and everything I describe is entirely runnable in Terra today.
Why PathSeq?
The PathSeq method was originally developed to discover and characterize pathogens infecting a host organism (such as a human) in an unbiased manner, taking advantage of the advances made in whole genome sequencing (Kostic et al., 2011). Instead of looking for specific pathogens based on known sequence, as was traditionally done before, investigators could now sequence a biological sample from the host, subtract all reads that align to the host genome, and identify pathogens by running searches using the remaining non-host reads against a database of microbial references. The search results can then be used to produce a table of the microbial organisms detected in the host sample.
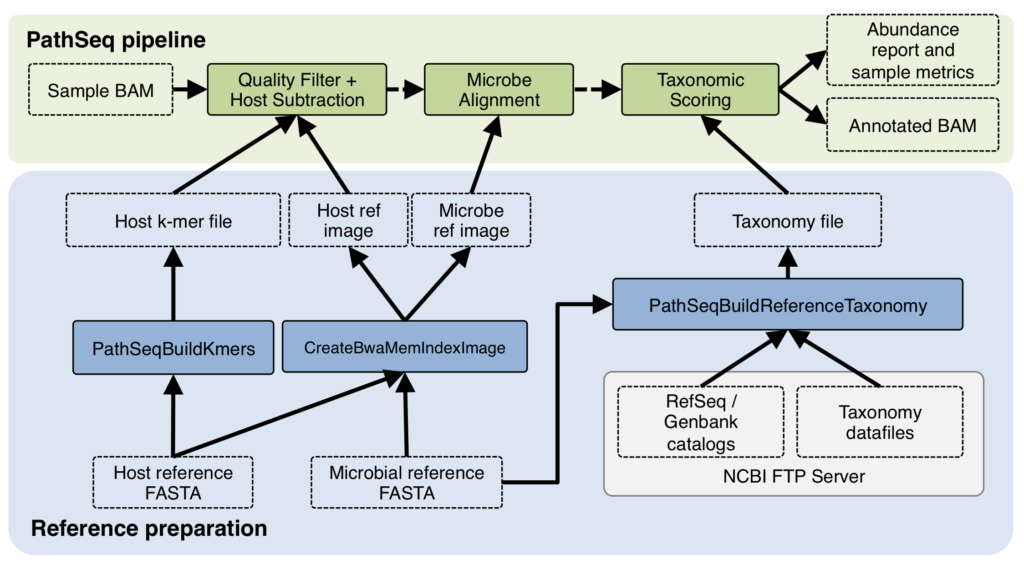
It’s interesting to note that in that use case for PathSeq, the human genome sequence was a by-product of the process, and was promptly thrown out in order to focus on the pathogens. In my use case, what the lab ultimately wanted was to produce high-quality human genome data, not study pathogens! Yet, to help them do that, I needed to figure out two things: (1) was the issue indeed due to microbial contamination, and if so (2) what kind of microbes were they — which would help identify where the contamination was coming from. PathSeq promised to give me answers to both questions.
As it happens, one of my colleagues at the Broad Institute, Mark Walker, had implemented a new version of the PathSeq method in GATK that improves on the previous one by incorporating faster computational approaches, broadening the use cases that the pipeline can support, and leveraging the Spark framework available in GATK4 to enable parallelized data processing (Walker et al., 2018).
And so I set out to apply Mark’s GATK PathSeq pipeline to the problem dataset.
Running PathSeq in Terra
Conveniently, the GATK team make a lot of their pipelines available in public workspaces in Terra, where the workflows are already configured to run according to the relevant best practices, with example data to show how the inputs need to be set up, how the files should be formatted and so on.
So I started by cloning the PathSeq workspace, familiarizing myself with how the pipeline is set up, and referring to the paper and the accompanying how-to tutorial to understand specific details.
I found that to run the pipeline, I was going to need to go through 3 main steps: (1) setting up the data to use Terra’s system of data tables for data management, (2) tweak the preloaded workflow configuration to run on my data, and (3) launch the pipeline on the data.
1. Setting up the data
Terra uses a system of data tables that helps you manage data and outputs in a scalable way. You can learn more about that in this introduction to Terra data tables; I’m just going to describe how to use the system to replicate what I did.
The workspace has some example data tables already set up, but you don’t need them (they are for a somewhat different use case as we’ll see shortly) so you can start by deleting them to reduce clutter.
You then create a load file (basically a data manifest) listing the sample IDs, with relevant sample metadata and file paths in a “sample” table. The load file is in “tab-separated values” format, aka TSV.
Here is a dummy example to show what the load file should look like (with simplified paths):
Sample TSV
    entity:sample_id percent_aligned WGS_bam_path
    sample1 68 gs://bucket/directory/file1.unmapped.bam
    sample2 80 gs://bucket/directory/file2.unmapped.bam
    sample3 76 gs://bucket/directory/file3.unmapped.bam
    sample4 99 gs://bucket/directory/file4.unmapped.bam
The column labeled percent_aligned contains the percent of aligned reads as reported by the preceding data processing pipeline. This column isn’t needed for running the PathSeq pipeline but will be used in the Python Notebook.
At the time I did this work, you also had to define a sample set (the list of samples you want to run a pipeline on for batch processing) using another load file, but nowadays you can do that on the fly in Terra.
Once your load file is ready, you upload it in the DATA tab of your workspace, and the system turns it into a table as shown below.
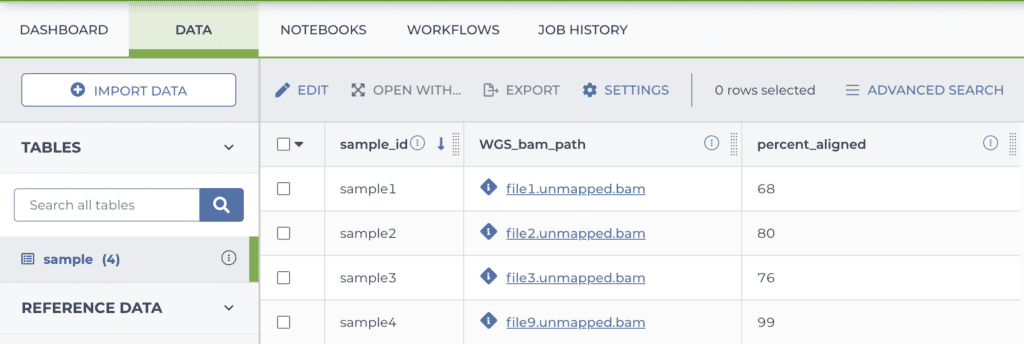
Note that my data files were already on the cloud, so I just had to list their locations. If you have data elsewhere you need to put them in cloud storage; either in a bucket you manage yourself (outside of Terra) or in the storage bucket attached to your Terra workspace.
2. Tweaking the workflow configuration
The PathSeq workspace actually contains multiple accessory workflows in addition to the main PathSeq workflow, all of which you can find in the aptly-named “WORKFLOWS” tab.
To replicate my analysis you just need the one called “03-pathseq-pipeline-WGS-meats”.
That name? Funny thing, the workspace was made to showcase a particular use case for PathSeq that’s a little different than mine: it’s an analysis that shows how to detect contaminating DNA from various animals that humans consume as food. Because when people give a saliva sample or buccal (cheek) swab for sequencing, sometimes the sequencing picks up what they had for lunch! If there’s enough animal DNA in there that is close enough to human DNA to get mapped to the human genome reference, it can introduce a lot of noise into downstream analyses. Which makes you wonder: Do vegetarians get cleaner sequencing results? Perhaps the takeaway could be that we should all brush our teeth before taking a saliva/buccal swab for sequencing….
Anyway, when you click on the workflow you want, Terra takes you to the corresponding configuration page, which displays summary information and some selectors for determining what data the workflow will run on.
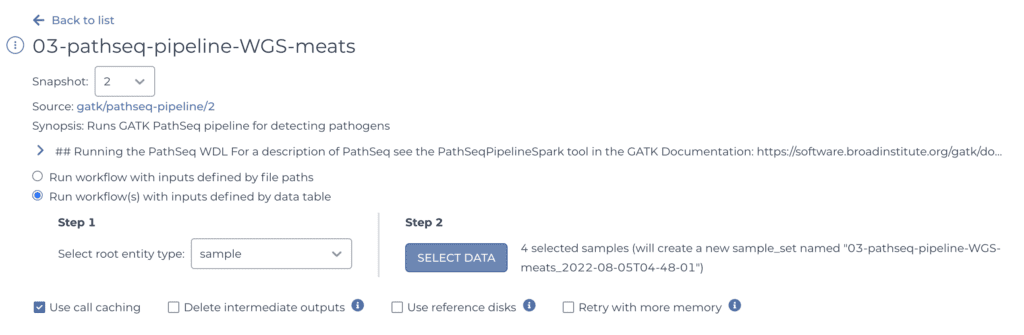
Since you have your samples neatly organized in a table, you can simply point the system to the sample table and select all the samples you want to process, using the selectors shown above.
Once that’s done, scroll down to the INPUTS form lower down on the same page (shown in part below). This form allows you to specify inputs and parameters for each of the workflow variables.
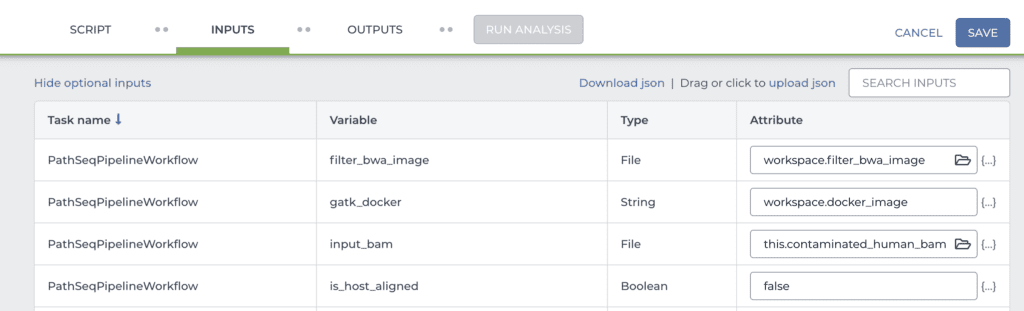
Here, you need to check the name of the data table column that the main input variable (“input_bam”) points to. In the example I gave above, I named the column with the bam file paths differently compared to the example data. Theirs was called “contaminated_human_bam”, whereas mine is called “WGS_bam_path”. So I would change “this.contaminated_human_bam” to “this.WGS_bam_path”.
![]()
If you’re looking to identify microbial contaminants, like I was, you also have to change the reference resources that are set up in the INPUTS form. The default configuration points to animal reference materials, which are set up as key-value pairs under “Workspace Data” in the DATA tab. You can either set up your own key-value pairs to point to the relevant resources or just replace the “workspace.<key>” by the relevant cloud storage paths. You can find paths to microbial resource files in the PathSeq section of the GATK Best Practices bucket, or you can generate your own based on more recent data. If you get confused as to which file to plug into which input variable, you can ask for help in the GATK forum.
Make sure to hit the “SAVE” button when you’re done editing out the INPUTS form (and frankly, consider doing it several times while you’re working, if you have a lot to tweak).
3. Launching the workflow
Step 2 was a lot but step 3 is the easy part. Once you have the input form filled out, all you need to do is hit the “Run Analysis” button, which brings up a confirmation dialog that restates how many workflows will be launched — one per sample in your sample list, if everything is set up correctly. This is a good time to check that you’re not about to launch ten thousand workflows by accident.
For what it’s worth, when I’m trying a new pipeline, I like to run a single sample first and wait until it completes before I run on the rest of the samples. That allows me to assess whether everything is behaving as expected, how long it takes to run and how much money it costs. That way I can estimate how much it will cost me to run the full cohort before I kick off anything big.
If the number looks reasonable, hit “Launch” and go take a break while the system starts executing the work behind the scenes. The system will automatically open the monitoring page where you can find the list of your workflow executions organized by submission batch.
Results of the PathSeq pipeline: Yep, there’s bacteria in there
So, where are the results? This is rather cool, actually. When you use the data tables system to manage data inputs, the results output by the workflow will get listed in a column (specified in the OUTPUTS form) in the relevant data table. That means you don’t have to go digging in output directories to find your output files (which are written to the workspace’s dedicated cloud storage bucket), and you’re able to launch other workflows on those new files without having to add them manually to a table.
The main results that are produced by the GATK PathSeq workflow are text files containing microbial identifiers, abundance scores and other related metrics. They clearly indicated the presence of microbial contaminants, but were not very user-friendly to interpret in their raw state, so for my investigation, I needed to analyze them further.
Characterizing the contamination in a Jupyter Notebook
My main objective was to see what was the top contaminating genus, and how it related to the “Aligned” value that we had for each sample. I decided to do this in Python in a Jupyter Notebook, which at the time was a beta feature in FireCloud. Now it’s a fully supported feature in Terra; you can learn more about it by following the Notebooks Quickstart tutorial.
Have a look at the HTML-rendered version of the completed Jupyter Notebook if you’d like to see the exact code I used and examine my findings for yourself.
First, I used Python functions to retrieve the metrics produced by the PathSeq workflow, extracting the vital information from metrics, then creating a sorted table with the extracted data to show a clear picture of what PathSeq found. The first major finding was that the top microbial genus present overall was a genus of proteobacteria called Burkholderia.
I then generated a scatter plot using the percent of alignment from the original reads on the X axis, and percent of these samples having reads aligned to the top contaminating genus on the Y axis, as shown below.
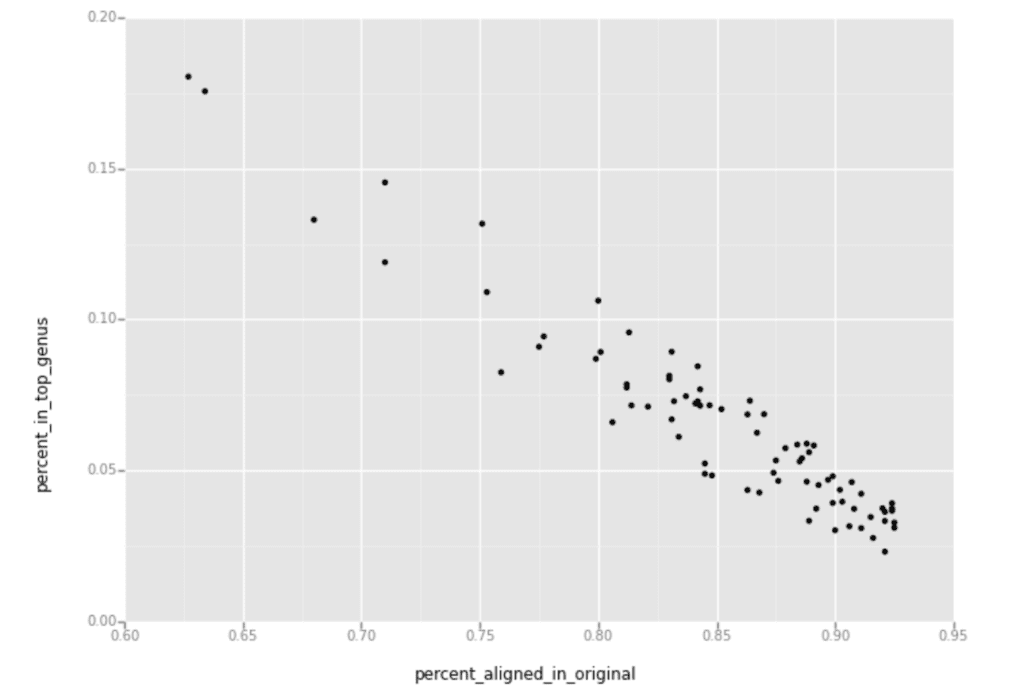
The downward slope you see in this plot shows that the samples with fewer reads aligned to the human reference had more reads aligned to the top microbial genus identified by PathSeq.
Separately, I also looked up how many of the samples were contaminated by the top-scoring genus, and found that all 78 problem samples were affected by Burkholderia contamination.
Epilogue
With these results in hand, I went back to the collaborator to discuss how PathSeq identified Burkholderia as the likely contaminant. Given other key details such as the location where the samples were collected (which had not been conveyed to me in advance), it made sense to the project manager that this proteobacteria would be detected as the contaminant. As a result, the collaborator has since identified some problems in their sample-collection protocols and have taken action to improve them.
I’ve encountered all sorts of weird quality issues in sequencing data over the years, and it can be quite fun to tackle them as a mystery to solve through careful analysis. I hope you found this story interesting, and possibly even helpful for your own work.
Feel free to try out any of the resources I mentioned for yourself, especially the public PathSeq workspace. The “meat contamination” use case is a rather interesting story in itself, and that project led to the creation of workflows to generate synthetic hybrid meat products for testing purposes (strictly virtual!) which could be reused for all sorts of interesting purposes.
You might also be interested in another Terra blog post involving PathSeq being used to identify viral insertions in the human genome. That one has IGV screenshots, which is always a sign of a good time.
So have fun and if you end up doing something with any of this, I would love to hear about it.
This story previously appeared in an earlier form on the GATK blog.
Resources
GATK blog about Terra workspaces
PathSeq paper citation
Mark A Walker, Chandra Sekhar Pedamallu, Akinyemi I Ojesina, Susan Bullman, Ted Sharpe, Christopher W Whelan, Matthew Meyerson (2018) GATK PathSeq: a customizable computational tool for the discovery and identification of microbial sequences in libraries from eukaryotic hosts, Bioinformatics, bty501, https://doi.org/10.1093/bioinformatics/bty501