Alessandro Culotti is a Senior Product Manager in the Data Sciences Platform at the Broad Institute. He is responsible for Terra’s Interactive Analysis product direction and strategy. In this guest blog post, Alessandro unveils an exciting update and invites you to try it out for yourself.
As increasing amounts of biomedical research data moves to the cloud, our goal is to provide you with the tools you need to perform all of the relevant analyses in one place. Accordingly, we’ve been working to adapt Terra’s Cloud Environments system to support a wider range of interactive analysis applications. This is a multi-step process that we’ll be talking about in several upcoming blog posts; today I’m excited to unveil the first step on this journey, which we’re inviting you to take with us.
We’ve been redesigning the part of the interface that provides access to the interactive analysis applications supported by Cloud Environments, i.e. Jupyter Notebook, RStudio and Galaxy. The new design aims to provide a more consistent and intuitive experience across these applications as well as those we plan to add in the future.
To ensure we’re heading in the right direction, we’re releasing the new design as an opt-in beta version and inviting you to give us feedback on how it’s looking so far.
Highlights of the new design
Under the new design, the “Notebooks” tab is transformed into the more general “Analyses” tab, from where you can access the multiple applications available for Interactive Analysis in Terra. Accordingly, the list of Notebook files (.ipynb) becomes the list of “Your Analyses”, which now supports including R Markdown files (.Rmd). Just like Notebook files, any R Markdown files created in or added to the Analyses tab will be automatically stored in the workspace bucket and synced between the bucket and your persistent disk.
Finally, the Cloud Environment widget located at the top right-hand corner of the page moves to a new sidebar within the tab itself, where two buttons provide quick access to the Environment Configuration menu and the Terminal, respectively.
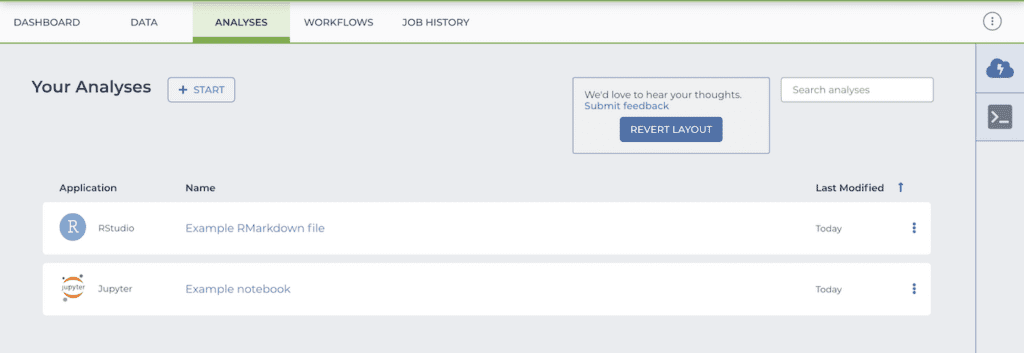
If you already have analysis files and a Cloud Environment set up, getting back to work is as easy as clicking on one of the files and following the prompts to open it in the relevant application.
Otherwise, click the Start button to create a new file or upload an existing file from your computer. If you don’t already have a suitable Cloud Environment set up, the system will walk you through the necessary steps to create one.
A clearer path to configuring and managing your Cloud Environments
Previously, the environment configuration menu lived in the widget labeled Cloud Environment located at the top right-hand corner of the page. As noted above, we moved this functionality to a new sidebar in the Analyses tab, represented by a cloud icon, and officially renamed it “Environment Configuration”.
Clicking on the “Environment Configuration” icon opens the “Cloud Environment Details” pane shown below, which you can use to configure, start, stop, or edit your Cloud Environments.
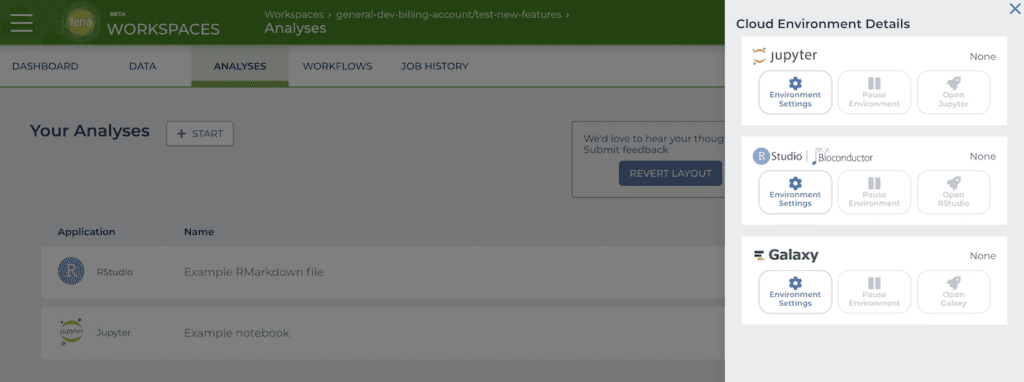
As you can see in the screenshot, the Cloud Environment Details pane currently shows all three applications — Jupyter, RStudio, and Galaxy — as independent options. Be aware that Jupyter and RStudio are mutually exclusive, i.e. you can’t run both at the same time due to a current limitation of the system (to be addressed in future work). However, Galaxy can be run in parallel to either one of the other two.
When you start a Cloud Environment, the corresponding application logo (Jupyter, RStudio or Galaxy) appears in the sidebar of the Analyses tab, along with a colored dot that represents the status of that environment. You can view a more detailed visual and textual description of the environment’s status by clicking the Environment Configuration button (cloud icon) on the sidebar to display the Cloud Environment Details pane.
If you navigate away from your environment, you can always hop back in by clicking the corresponding logo in the sidebar.
To learn more about interactive analyses and Cloud Environments in Terra, see the Interactive Analysis section of the Terra support site. For step-by-step instructions on how to create a new interactive analysis environment for a specific application, see the relevant docs for Jupyter, RStudio and Galaxy.
Try it out and tell us what you think
You can activate the new design by going to the Notebooks tab in any workspace and clicking “Try new layout”. If at any point you decide you’d rather go back to the original design, simply click the “Revert layout” button. In either case, we’d be grateful if you could tell us what you think of the new version; every bit of feedback, be it positive or negative, will help us refine the design and ensure a more productive experience for everyone when we eventually switch to the new version.
The simplest way to send us your comments is to click on “Submit feedback” at the top of the Analyses tab, which will open a short survey (just 3 questions). You’re also welcome to reach out to the Helpdesk at any time, or comment in the community forum.
Resources
For more general information about Terra’s interactive analysis capabilities, see the following course and tutorials: