PANOPLY is an innovative computational framework for applying state-of-the-art statistical and machine learning algorithms to transform multi-omic data from cancer samples into biologically meaningful and interpretable results. In this guest blog post, D. R. Mani, principal computational scientist in the Broad Institute’s Proteomics Platform and lead author of the recently published PANOPLY paper, explains how his team is leveraging Terra to make PANOPLY accessible to a wide range of researchers.
Proteogenomics involves the integrative analysis of genomic, transcriptomic, proteomic and post-translational modification (PTM) data produced by next-generation sequencing and mass spectrometry-based proteomics. Effectively analyzing proteogenomics data involves deploying complex computational algorithms that integrate multiple omics data types, and unfortunately, such algorithms remain largely inaccessible to non-computational cancer researchers. We decided to address this problem by building a framework called PANOPLY that would streamline analysis of proteogenomics data and would be easy to use, robust, flexible and reproducible. We wanted researchers to be able to use it on any standard computational platform, so we designed PANOPLY to be modular and portable, but we chose to also make it available through Terra to increase access, scalability and ease of use.
A “greatest hits” compilation of methods from flagship CPTAC studies
PANOPLY was not born in a vacuum. Proteogenomic analysis has been extensively applied to cancer samples in many studies published under the auspices of the Clinical Proteomic Tumor Analysis Consortium (CPTAC) and the International Cancer Proteogenome Consortium (ICPC), a global effort to accelerate the understanding of the molecular basis of cancer through the application of proteogenomics. These flagship studies have advanced the field by developing cutting-edge computational methods. PANOPLY combines representative methods from these studies, which originated as disparate algorithms implemented by different research groups, into a unified pipeline within a computational framework built to be modular, scalable and reproducible.
PANOPLY takes as input a set of pre-formatted datasets derived from DNA, RNA and protein profiling, along with phenotype and clinical annotations (see Figure 1). Any normalization or filtering for proteomics data is accomplished using Data Preparation Modules. Analysis ready data is then channelled to a series of Data Analysis Modules, many of which perform integrated multi-omic analysis. Almost all analysis modules output an interactive HTML report summarizing results, in addition to detailed tables and plots.
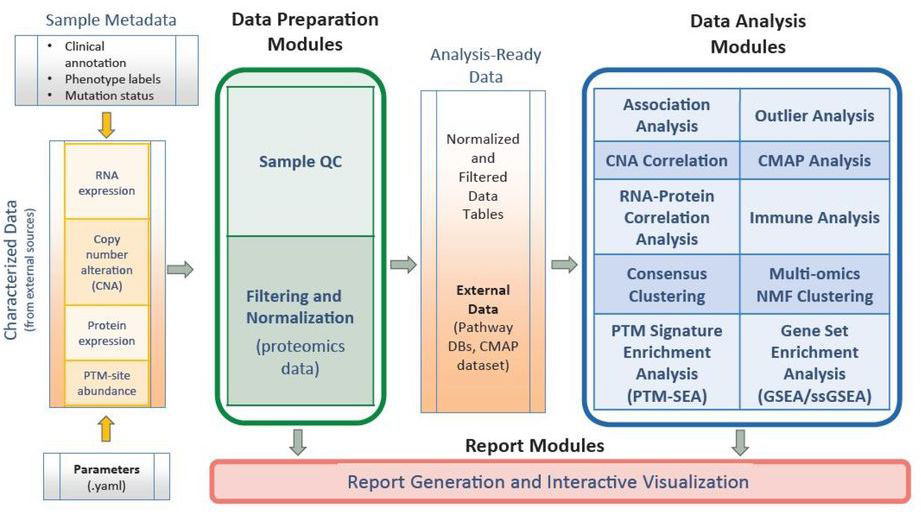
Figure 1. PANOPLY architecture overview, showing various data types used along with modules for data pre-processing and analysis.
We implemented each module as a standalone workflow, and we created one unified workflow that imports all the module workflows into a full end-to-end pipeline. This enables researchers to easily apply the full complement of proteogenomics analyses to their data out of the box, which we expect to be the majority use case.
We also anticipated that some researchers might want to apply individual methods to a variety of use cases, so to provide that flexibility, we designed the individual modules to be runnable by themselves. We also made it possible to compose custom pipelines that include these modules in combination with other modules that researchers might write or publish themselves. This way, researchers can take advantage of the groundbreaking work done by various CPTAC groups, and they can build on that work to further advance the field, with less effort spent on figuring out tooling.
All workflows are written in WDL and use containerized tools, so they can be run on any standard computational platform. All code — including algorithm implementations and WDLs — is open source and available in GitHub.
Leveraging Terra workspaces to increase access and usability
We recognized that enabling a wide range of people to use PANOPLY, especially those with less computational experience, would require more than just releasing code. We wanted a way to make PANOPLY usable out of the box, with tutorials that bundle example data, and we wanted to be able to update all of it easily whenever we make improvements to the software.
To that end, we put together 3 main resource workspaces that are all publicly available in Terra (see Figure 2): (i) a “Modules” workspace containing separate workflows for each analysis module; (ii) a “Pipelines” workspace with preconfigured unified pipelines for fast and easy execution and (iii) a “Tutorial” workspace showing inputs and outputs for the tutorial dataset. In order to further simplify the process of setting up a new analysis workspace, we used the “Notebooks” feature of Terra to provide a startup notebook that includes a step-by-step guide for users.
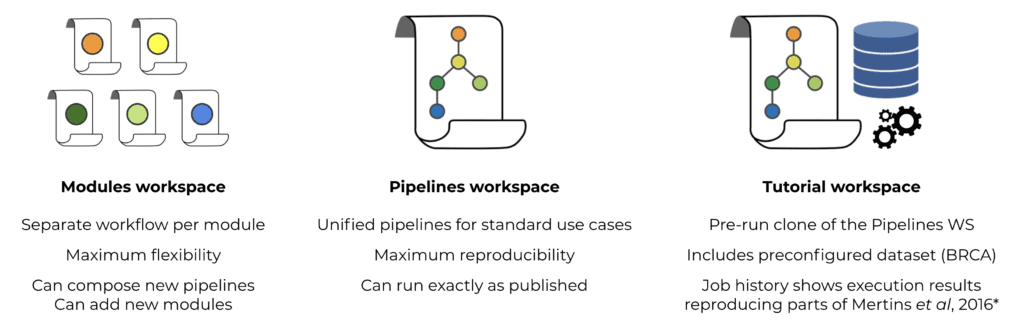
Figure 2. Organization and contents of the PANOPLY workspaces on Terra.
The tutorial dataset is centered on TCGA samples that were also subjected to proteomics profiling, adapted from our first proteogenomics publication on breast cancer (BRCA) (Mertins et al., 2016), and comes with everything needed to run the unified PANOPLY pipeline. The tutorial itself is organized as an easy to follow step-by-step procedure starting from cloning the workspace to uploading the data and running the pipeline. There is also documentation on expected results and how to interpret the many interactive reports generated by PANOPLY.
In addition to these core resources, we also provide additional “case study” workspaces showcasing the analysis of BRCA samples (Krug et al., 2020) that were freshly collected exclusively for proteogenomic analysis, along with analysis of a lung adenocarcinoma (LUAD) cohort (Gillette et al., 2020).
We encourage you to check out the workspaces and try out the tutorial for yourself. If you’d like to share some feedback, please email us proteogenomics@broadinstitute.org; we look forward to hearing from you.
Resources
PANOPLY paper
Mani, D.R., Maynard, M., Kothadia, R. et al. PANOPLY: a cloud-based platform for automated and reproducible proteogenomic data analysis. Nat Methods (2021). https://doi.org/10.1038/s41592-021-01176-6
See also the preprint in biorxiv.
Blog references
Mertins, P. et al. Proteogenomics connects somatic mutations to signalling in breast cancer. Nature 534, 55–62 (2016).
Krug, K. et al. Proteogenomic Landscape of Breast Cancer Tumorigenesis and Targeted Therapy. Cell 183, 1–21 (2020).
Gillette, M. A. et al. Proteogenomic Characterization Reveals Therapeutic Vulnerabilities in Lung Adenocarcinoma. Cell 182, 200–225.e35 (2020).
Full list of PANOPLY workspaces
| PANOPLY Release v1.0 | PANOPLY pipelines | PANOPLY_Production_Pipelines_v1_0 | Terra workspace with pre-configured pipelines, including startup notebook for easy data input and workspace configuration |
| PANOPLY modules | PANOPLY_Production_Modules_v1_0 | Terra workspace with all individual modules. This enables users to pick and choose modules and customize execution, but requires more knowledge of setting up inputs. | |
| Tutorial | Tutorial description | PANOPLY-Tutorial (Github wiki) | Step-by-step instructions for running the PANOPLY tutorial |
| Tutorial workspace | PANOPLY_Tutorial | Terra workspace with tutorial instructions, data, analysis and results | |
| Case Studies | BRCA | PANOPLY_CPTAC_BRCA | Terra workspace with data, analysis and results from the (Krug, et al,., 2020, Cell) breast cancer study |
| LUAD | PANOPLY_CPTAC_LUAD | Terra workspace with data, analysis and results from the (Gillette, et al,., 2020, Cell) lung adenocarcinoma study |