Stephen Fleming is a Machine Learning Scientist in the Methods group of the Data Sciences Platform at the Broad Institute. As part of Mehrtash Babadi’s team, he works to develop analysis tools for single-cell RNA sequencing (scRNA-seq) data, and he analyzes scRNA-seq datasets in Patrick Ellinor’s group as part of the Precision Cardiology Lab. In this guest blog post, Stephen introduces CellBender, a software package for eliminating technical artifacts from high-throughput scRNA-seq and other multi-omics data. The Cellbender manuscript preprint is available on biorxiv.
Microfluidics-based technologies for probing the contents of individual cells have been revolutionizing how we approach cell biology. In less than a decade, single-cell RNA sequencing has gone from being a cool new concept with a lot of potential, to a mainstream technique that has already enabled important discoveries (e.g. Montoro et al., 2018; Delorey et al., 2021), and is now inspiring spin-offs like single-cell proteomics and spatial transcriptomics.
Yet like any data generation technology that has come before, the process of turning biological material into digital signal retains some inherent messiness. On the wetlab side of things, even the most stringent protocol cannot completely eliminate enzymatic side-processes that produce spurious library fragments, contamination by exogenous or endogenous ambient transcripts, potential impurity of barcode beads, and barcode swapping during amplification and/or sequencing.
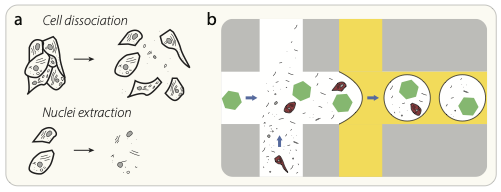
Cell dissociation and nuclei extraction lead to the presence of cell-free RNA in solution. (b) Schematic diagram of the proposed source of ambient RNA background counts. Cell-free “ambient” RNAs (black lines) and other cellular debris are present in the cell-containing solution, and these RNAs are packaged up into the same droplet as a cell (red), or into an otherwise empty droplet that contains only a barcoded capture oligo bead (green hexagon).
In the generated data, these issues show up as systematic background noise. For example, a highly-expressed marker gene might look as though it is expressed in all cell types at a low level, rather than being specific to a certain cell type. This sort of background noise masks the true cell-type-specificity of gene expression —and manifests incorrectly as spurious differential expression signals— in downstream analyses. Systematic background noise is dataset-specific, and can cause a batch effect that hinders dataset integration and atlasing efforts (see Supplementary Fig. S1 in Eraslan et al., 2022).
Identifying and removing background noise with machine learning
To address this pervasive problem, we first investigated the phenomenology of background RNA counts in a variety of scRNA-seq and snRNA-seq experiments, then developed a modeling approach that uses machine learning to identify and subtract those background counts, resulting in a cleaner and more reliable dataset.
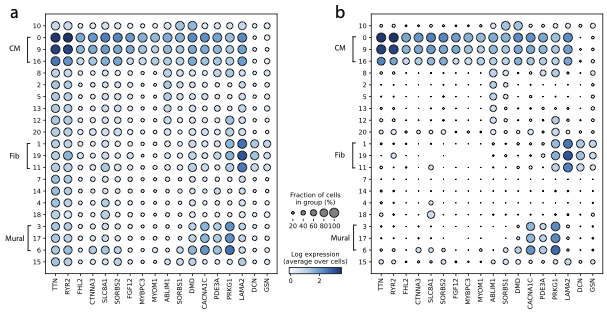
Removal of background RNA from a published human heart snRNA-seq atlas from Chaffin et al., 2022. a) Dotplot showing several highly-expressed genes in the raw dataset; b) Same dotplot after noise removal with CellBender.
We implemented this approach in Python, using the popular Pytorch framework and the probabilistic programming language Pyro. Our software package, called Cellbender, is fully open-source and available in Github.
When we initially reported our results in a 2019 preprint, CellBender was the only truly unsupervised option for background noise removal in single-cell datasets. As a bonus, in addition to producing a clean dataset, CellBender computes several other quantities of interest, including the probability that each droplet in the experiment contains a cell (since lots of droplets in these experiments are empty, and it can be hard to tell). We found that our approach outperformed previously existing tools for cell-calling, including CellRanger and EmptyDrops.
Since the 2019 preprint, CellBender has been applied to a range of real world studies by our collaborators as well as independent groups. Some notable works include studies of the human heart in health and disease (Tucker et al., 2020; Chaffin et al., 2022; ), the human intestine (Holloway et al., 2021), human and mouse adipocytes (Sun et al., 2020; Dong et al., 2022), human tissues infected by SARS-CoV-2 (Xu et al., 2020; Delorey et al., 2021; Ziegler et al., 2021; Melms et al., 2021), and a large human cross-tissue atlas (Eraslan et al., 2022).
All this road-testing has led to further improvements and a new updated preprint that we are submitting for publication. In the new preprint, we additionally demonstrate that our approach outperforms a 2020 method for noise removal called DecontX, and can be applied to other omics data types, such as the antibody capture features that are measured together with RNA in a CITE-seq experiment.
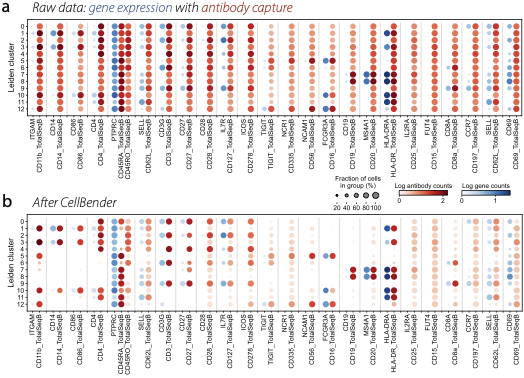
Removal of background counts from a mutimodal CITE-seq dataset, showing gene expression in blue and antibody capture in red. (a) Raw data from a public 10x genomics PBMC dataset shows that most antibodies are measured in all cell types. (b) After CellBender, antibody counts become much more cell-type specific.
Get started with CellBender today
The Cellbender background removal tool is designed as a drop-in pre-processing step that can be run as a standalone operation or integrated into an existing workflow.
For convenience, we provide a WDL workflow that is preconfigured to run the background removal tool with GPU acceleration (Tesla K80) on a virtual machine in Google Cloud. We also created a public Terra workspace showcasing the workflow along with some test data, so you can view configuration details, browse the tool’s outputs, and even try it out yourself without having to install anything on your own computer.
If you’re not familiar with running workflows in Terra, check out the Workflows Quickstart and its accompanying video.
Among its outputs, the CellBender background removal tool produces an HTML report that includes quality metrics, as well as automatically generated commentary that is intended to guide the interpretation of those metrics. You can see an example of this in the public workspace as described below.
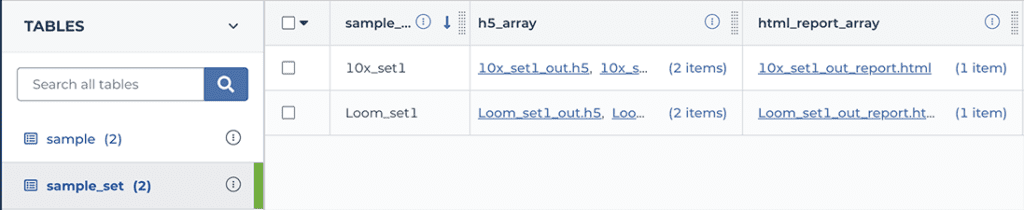
To view the report for a CellBender background removal run, navigate to the workspace’s DATA tab, click on “sample_set” in the left-hand TABLES menu, and then scroll the table view horizontally until you see the “html_report_array”. Click on one of the filenames in that column and hit the download button; this should open the html file in your browser. Scroll through the report to view metrics, plots and accompanying commentary.
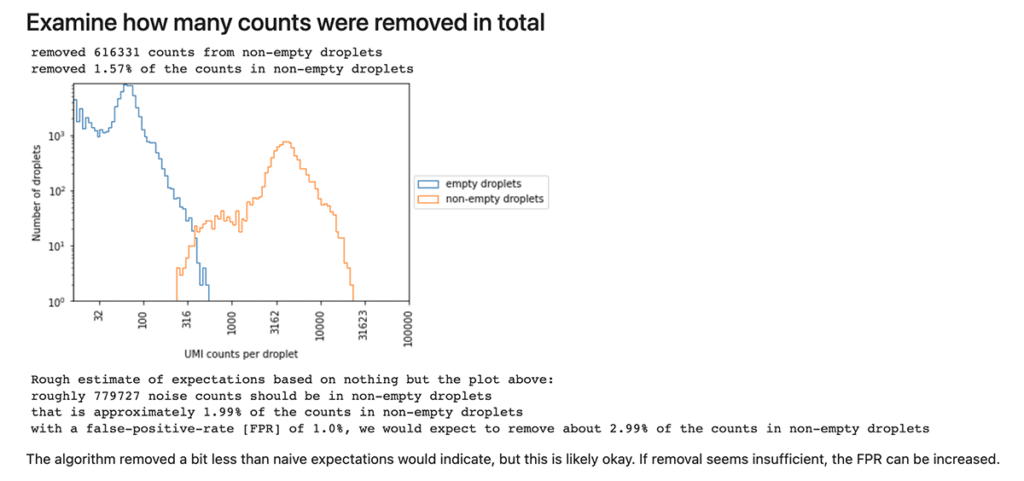
One of several sections in the Cellbender background removal quality report, consisting of a plot, summary statistics and a statement to guide interpretation.
We encourage you to try this out for yourself and let us know how it goes. If you experience any issues getting started with Terra, please reach out to Terra helpdesk. If you run into any problems with CellBender itself, feel free to open an issue in the CellBender repository on Github.
Resources
CellBender repository on Github